Under the Hood of Regression Metrics
May 12, 2025

As a car mechanic, you constantly estimate how long a job will take. Some estimates are spot-on. Others? Not so much.
Just like in real life, predictive models in data science try to estimate numerical outcomes — like repair times, sales, or costs. To understand how well your model performs, we use regression metrics.
Let’s explore five of them through one relatable analogy: estimating car repair time.
1. Mean Absolute Error (MAE)
“On average, how far off were my time estimates?”
MAE is the average absolute difference between your predicted time and the actual time.
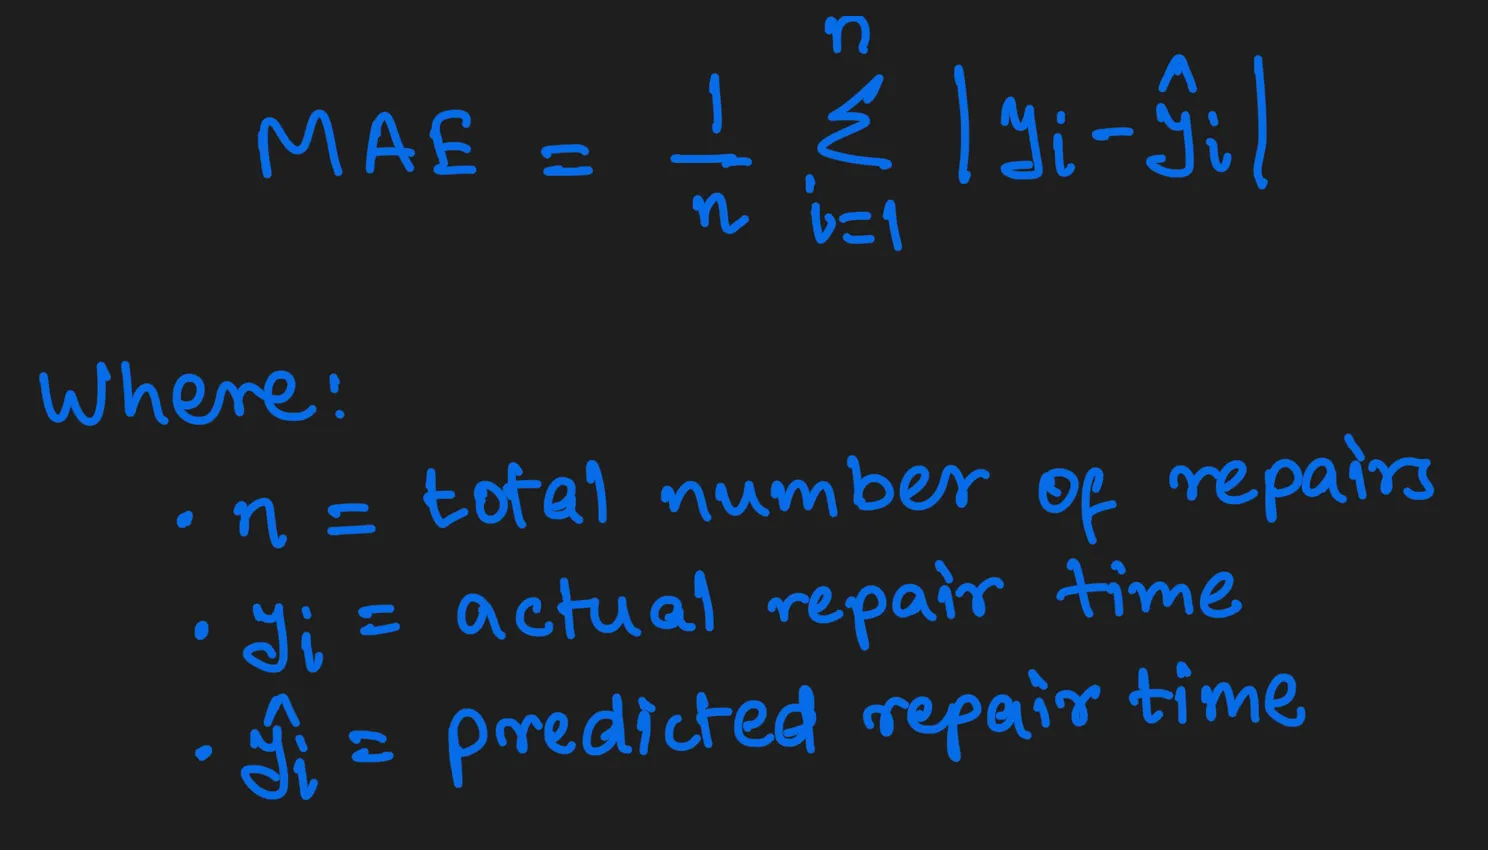
Use MAE when you want a simple, interpretable measure of average error.
2. Mean Squared Error (MSE)
“Did I make any really bad mistakes?”
MSE squares each error before averaging, so large mistakes are penalized more heavily.

Use MSE when you want your model to avoid big errors — where being off by 3 hours is worse than three 1-hour misses.
3. Root Mean Squared Error (RMSE)
“What’s the typical size of my error — in hours?”
RMSE is just the square root of MSE. It still penalizes large errors but returns the result in the same unit as the original value (e.g., hours).

Use RMSE for interpretability with sensitivity to outliers.
4. R² Score (Coefficient of Determination)
“How well do my estimates explain the actual variation in repair times?”
R² tells you how much better your predictions are than just guessing the average.
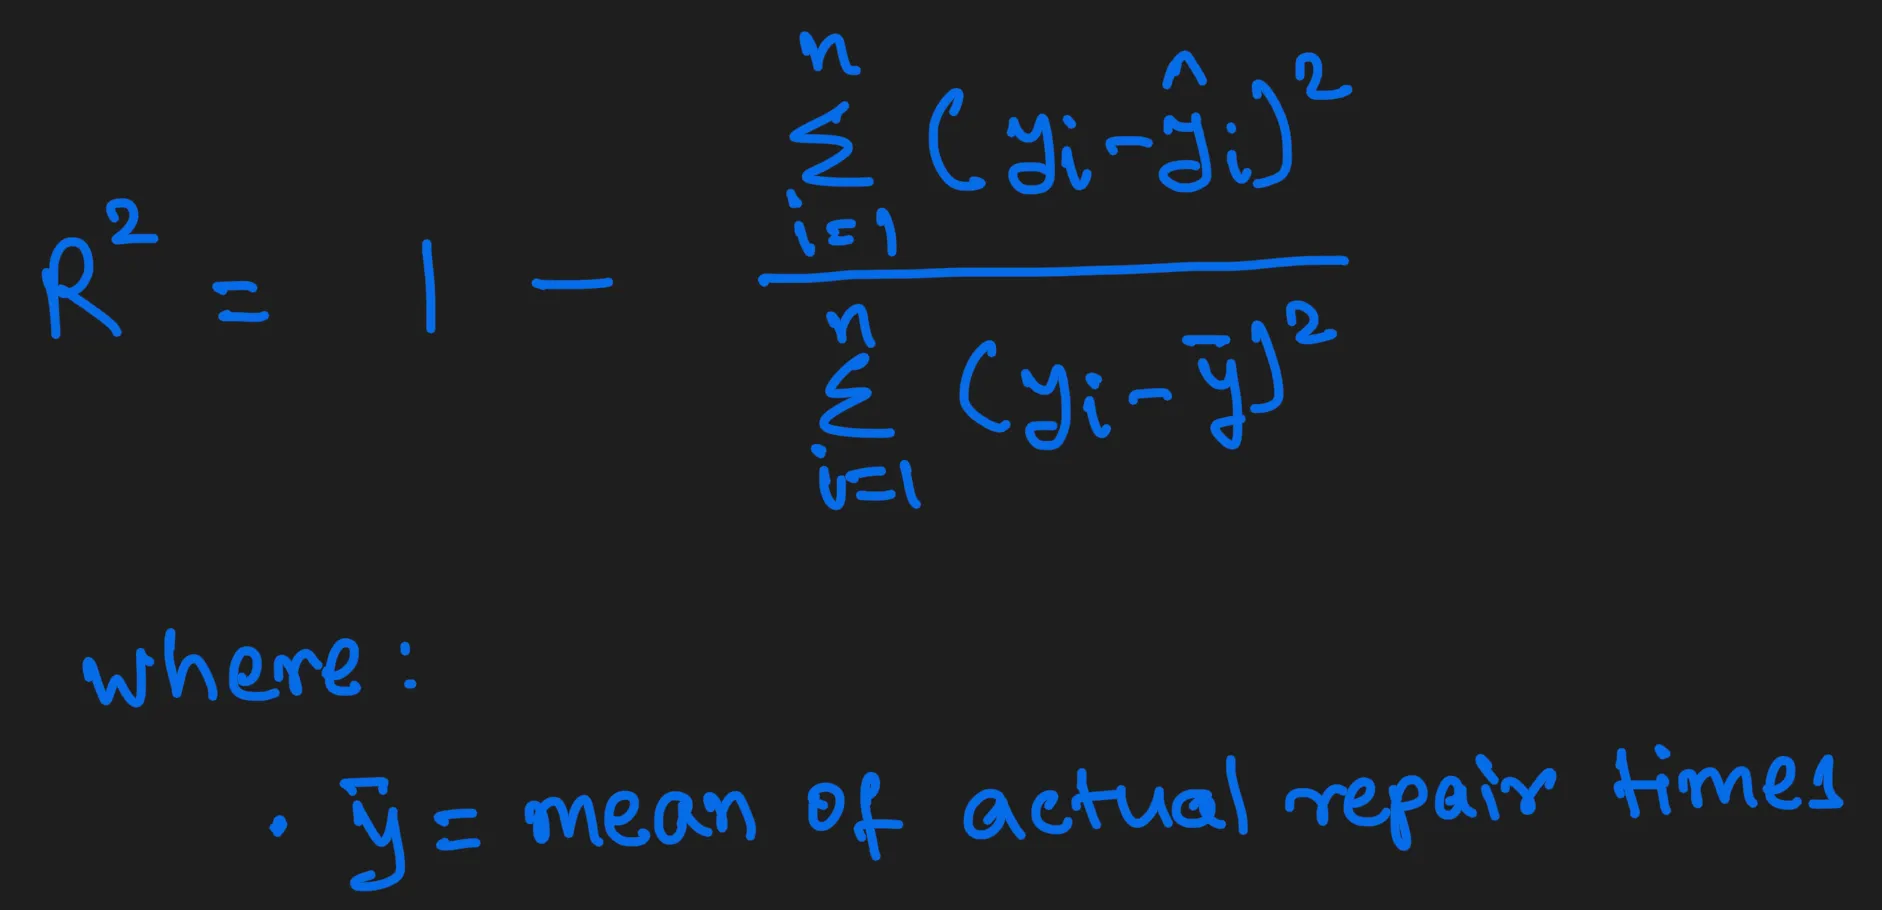
Use R² to understand model quality.
- R² = 1 is perfect,
- R² = 0 is no better than guessing the average,
- R² < 0 means worse than guessing.
5. Adjusted R²
“Did adding more features (like car age or weather) really help?”
Adjusted R² accounts for the number of predictors in the model. It only increases if the new features improve the model meaningfully.
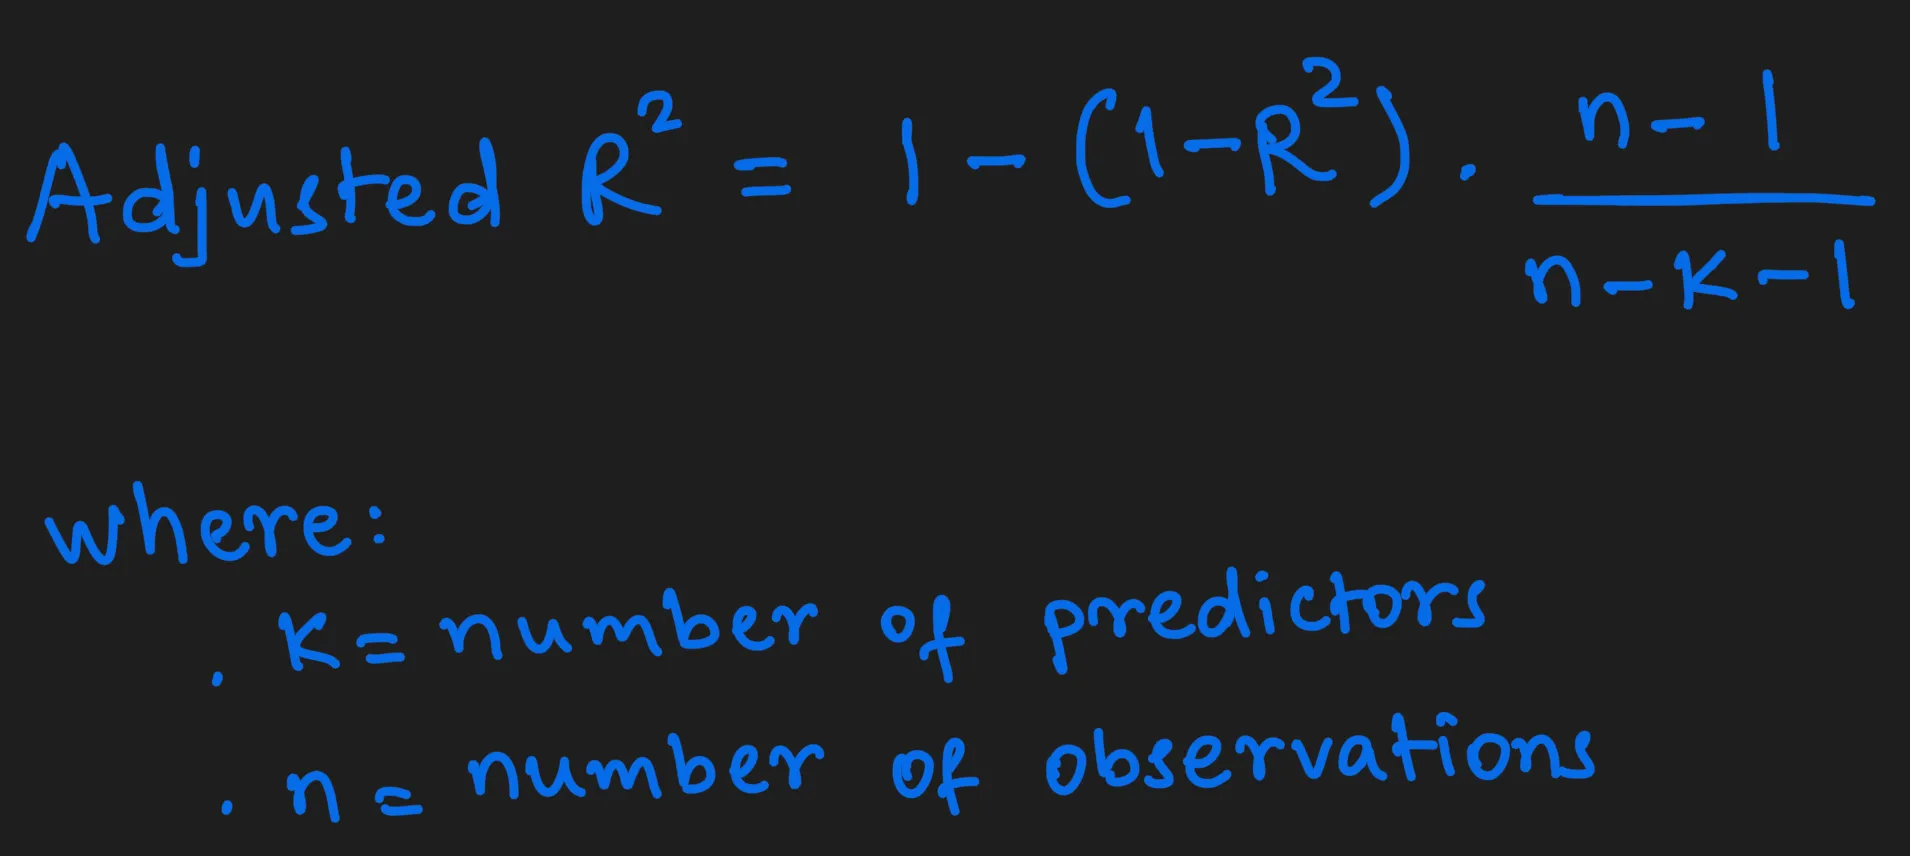
Use this when comparing models with different numbers of inputs.
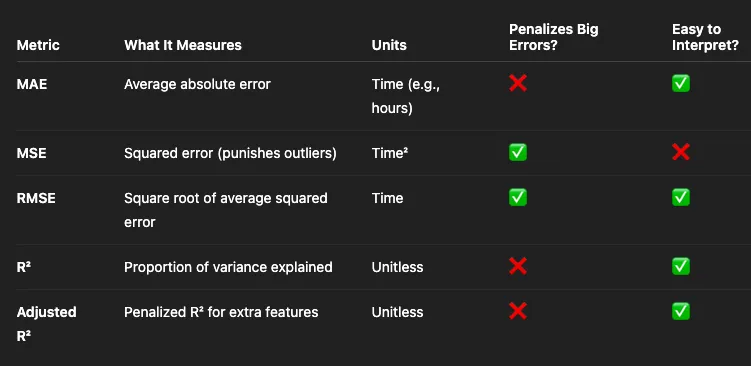
Summary Table
Final Tune-Up
Just like mechanics live and die by their time estimates, data scientists live by their model metrics.
- MAE tells you your average miss.
- MSE and RMSE tell you if your misses are painful.
- R² tells you how well you understand what drives variation.
- Adjusted R² keeps you honest when you're adding complexity.
Pick the right metric for the job — whether you're under the hood or under the hood of your data.