5 Signals, 500 Stocks, 1 Score: Inside a Swing Trading Screener
Feb 22, 2026
Have you ever looked at a stock chart and thought, "This looks like it's about to move up," but couldn't quite explain why you felt that? Turns out, that intuition can be broken down into a handful of measurable signals. And with the right tools, you can scan hundreds of stocks for those signals in minutes.
I recently built Nifty Swing Screener — an open-source tool that scans the Nifty 500 universe for swing trading opportunities. It detects technical signals, computes trade levels (entry, stop-loss, targets), and ranks candidates with a fully explainable scoring system.
What made this project particularly interesting: I built the entire thing in a few hours using Google AntiGravity as my AI pair programmer — from architecture to deployment.
What is Swing Trading?
Before we get into the "how," a quick primer for those who don't live in trading terminals.
Swing trading is a style of trading where you hold a stock for a few days to a few weeks, trying to capture a "swing" in price. Unlike day trading (minutes to hours) or investing (months to years), swing trading sits in the middle:
- You're looking for stocks that have pulled back to a support level and are showing signs of bouncing back up
- You define a clear entry price, stop-loss (to limit downside), and target (where you'd take profit)
- The goal is a favorable risk-to-reward ratio — ideally risking ₹1 to make ₹2 or more
The challenge? Manually scanning 500 stocks every day for these setups is impractical. That's where automation comes in.
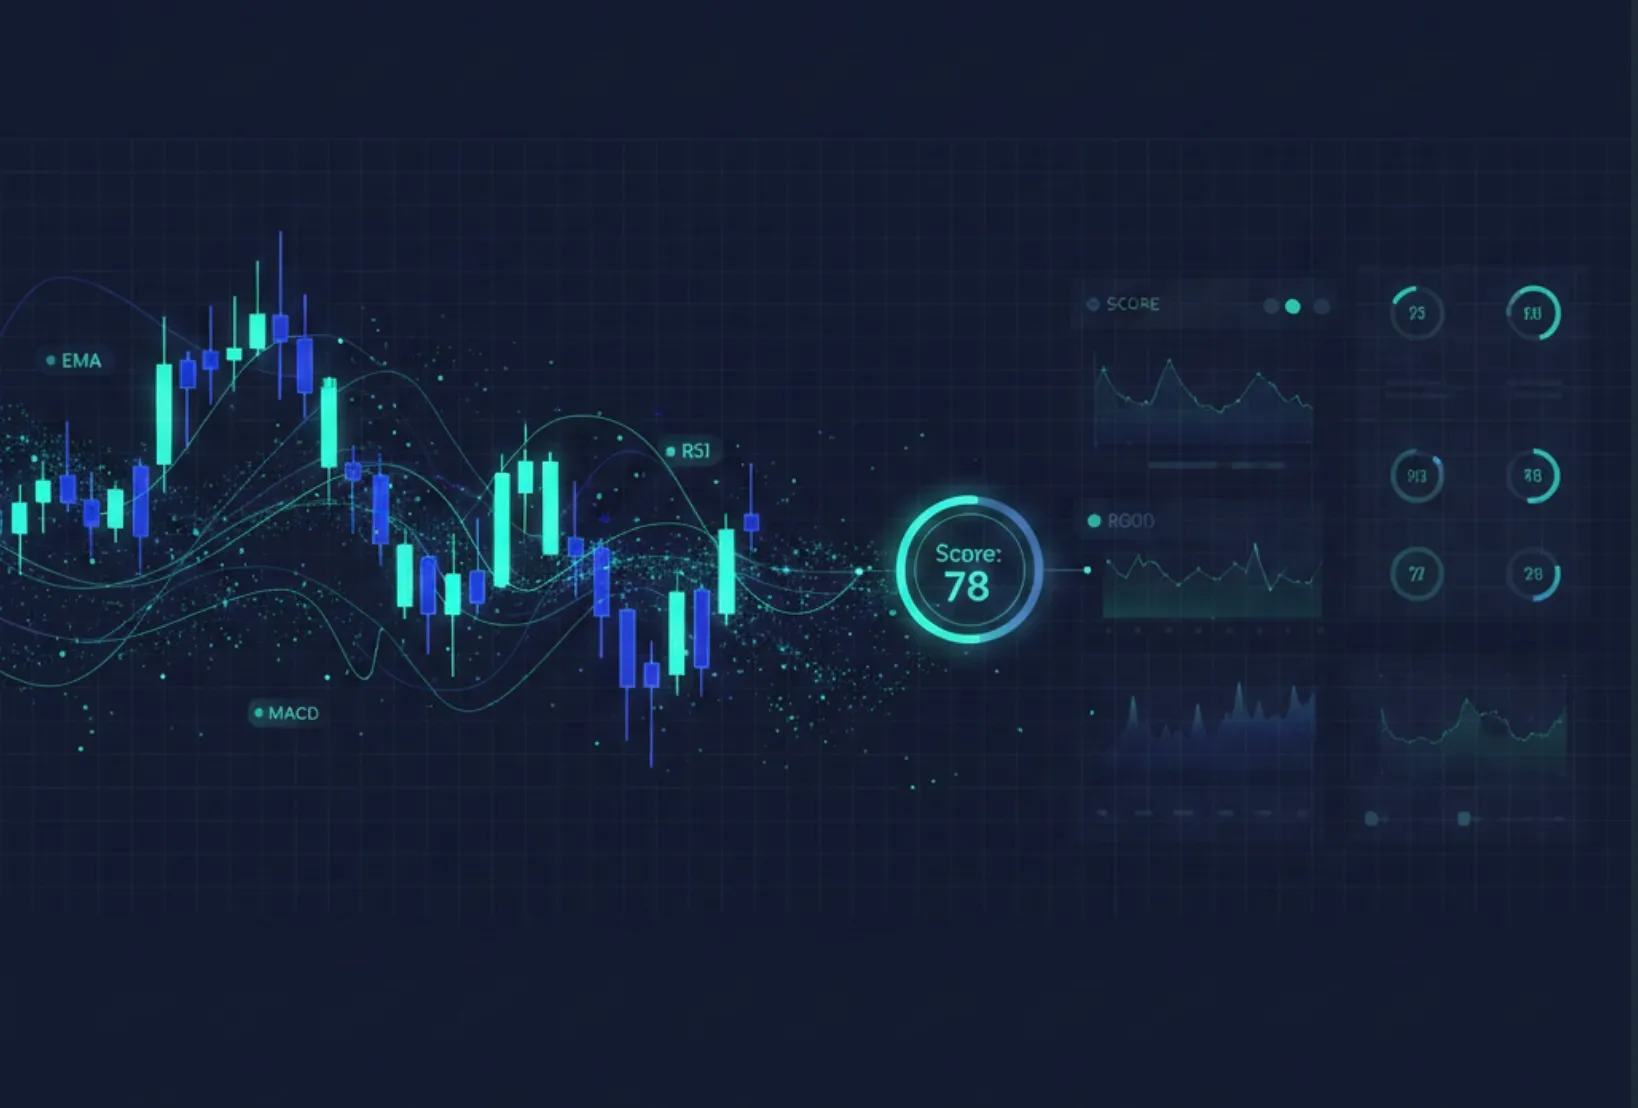
The Five Signals
The screener looks for five distinct technical signals. A stock needs at least two of these to qualify as a candidate:
📈 1. EMA Alignment (Trend Confirmation)
Exponential Moving Averages (EMAs) smooth out price data to reveal the underlying trend. When the short-term average (20-day) is above the medium-term (50-day), and both are above the long-term (200-day), the stock is in a healthy bullish structure.
Think of it as: "The recent trend, the medium-term trend, and the long-term trend all agree — this stock is going up."
📊 2. RSI Recovery (Momentum Shift)
The Relative Strength Index (RSI) measures how "fast" a stock has been moving. A reading below 40 suggests the stock has been sold heavily. When RSI dips below 40 and then starts rising back above it, it signals a potential momentum reversal — sellers are exhausting, and buyers are stepping in.
🔀 3. MACD Crossover (Trend Momentum)
The MACD compares two moving averages to spot changes in momentum. When the MACD line crosses above its signal line, it's a classic bullish crossover — suggesting the stock's momentum is shifting from negative to positive.
🔄 4. Support Bounce (Price Memory)
Stocks tend to "remember" certain price levels. Support levels are prices where buyers have historically stepped in. If a stock's price is within 2% of a known support level and is bouncing upward, it suggests the support is holding, and the stock is likely to push higher.
📢 5. Volume Surge (Conviction)
Price movement without volume is like applause from an empty room. When today's trading volume is 1.5× the 20-day average, it signals that the move has conviction behind it — institutions or large traders are participating.
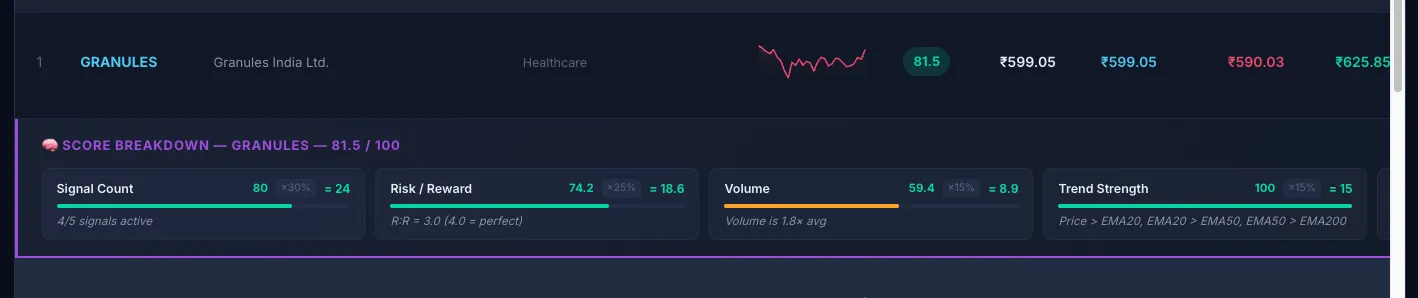
The Scoring System
Not all candidates are equal. The screener assigns a 0–100 Swing Score using a weighted formula:
- Signal Count (30%) — How many of the 5 signals fired
- Risk/Reward (25%) — Quality of the entry-to-target vs. entry-to-stoploss ratio
- Volume (15%) — Today's volume vs. 20-day average
- Trend Strength (15%) — How well the EMAs are aligned
- RSI Position (15%) — Whether RSI is in the ideal 40–60 "swing zone"
The best part? Every score is fully explainable. Click any score badge in the dashboard and you'll see a detailed breakdown of exactly why that stock scored the way it did — no black boxes.
Trade Levels: Entry, Stop-Loss, and Targets
For each candidate, the screener automatically computes:
- Entry — Current price, or snapped to nearest support if within 1%
- Stop-Loss — Based on ATR (Average True Range) × 1.5, cross-checked against support levels below
- Target — Either a 2:1 risk-reward projection, or the nearest resistance level above (whichever is higher)
- Risk:Reward Ratio — Only candidates with ≥ 2:1 R:R make the cut
This means every recommendation comes with a clear trade plan, not just a "buy" signal.
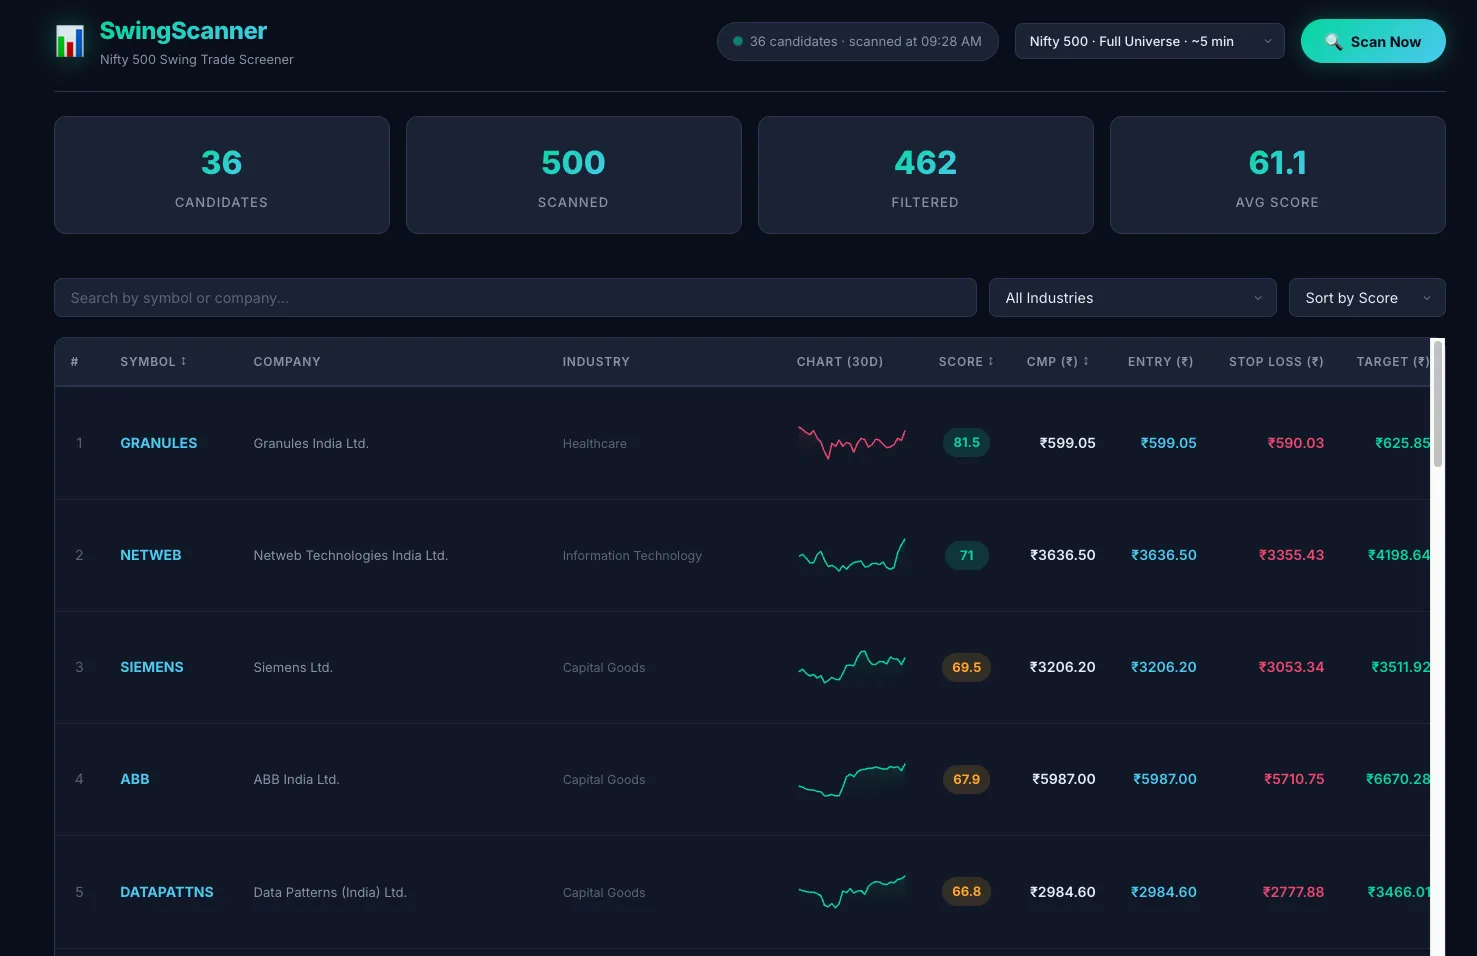
The Dashboard
The web dashboard brings it all together:
- Scan scope selector — Choose Nifty 50, 100, 200, or 500 stocks with estimated scan times
- Stats bar — Candidates found, stocks scanned, filtered, and average score
- Results table — Sortable by score, price, R:R, or signals with 30-day sparkline charts
- Score breakdown — Click any score to see the weighted factor analysis
- Search and filter — Filter by industry or search by symbol/company name
Built with Google AntiGravity
Here's the part that surprised me the most: I built this entire project — from blank folder to deployed dashboard — in a few hours, pair-programming with Google AntiGravity.
The AI didn't just write boilerplate. It:
- Designed the architecture (data layer → analysis layer → presentation layer)
- Implemented the technical analysis algorithms
- Built the interactive dashboard with a premium dark-themed UI
- Set up deployment on Render with a custom subdomain
- Even reviewed the code for clean coding principles before the GitHub push
It genuinely felt like working with a senior engineer who also happened to be a full-stack developer, a quant, and a DevOps engineer — all at once.
Try It Yourself
- 🚀 Live Dashboard: swing.arunavasircar.com
- ⚙️ Source Code: github.com/asircar/nifty-swing-screener
⚠️ Disclaimer
This tool is for educational purposes only. It is not financial advice. The signals and scores are based on historical technical data and do not guarantee future performance. Always do your own research and consult a qualified financial advisor before making any trading decisions.
This was a fun project that combined two things I enjoy — building software and understanding markets. If you're curious about technical analysis, or want to see what's possible with AI-assisted development, give the dashboard a spin and let me know what you think.
I'd love to hear: What would you build with an AI co-pilot?
#SwingTrading #TechnicalAnalysis #Python #FastAPI #OpenSource #GoogleAntiGravity #AIAssistedDevelopment #NiftySwingScreener