Demystifying Classification Metrics With Real-Life Analogies
Jul 14, 2025
If you've ever built a machine learning model or reviewed one in production, you've probably seen terms like accuracy, precision, recall, and F1 score. These metrics are commonly reported when evaluating classification models, but they are often misunderstood or misused.
Rather than just throwing formulas around, let’s take a practical approach. What does each metric actually measure, and when does it make sense to care about one more than the other?
To answer that, we’ll first understand the basic building blocks using a Confusion Matrix.
The Confusion Matrix
At the heart of all these metrics is a simple idea: comparing what the model predicted to what the actual label was.
Here’s what can happen in a binary classification task:
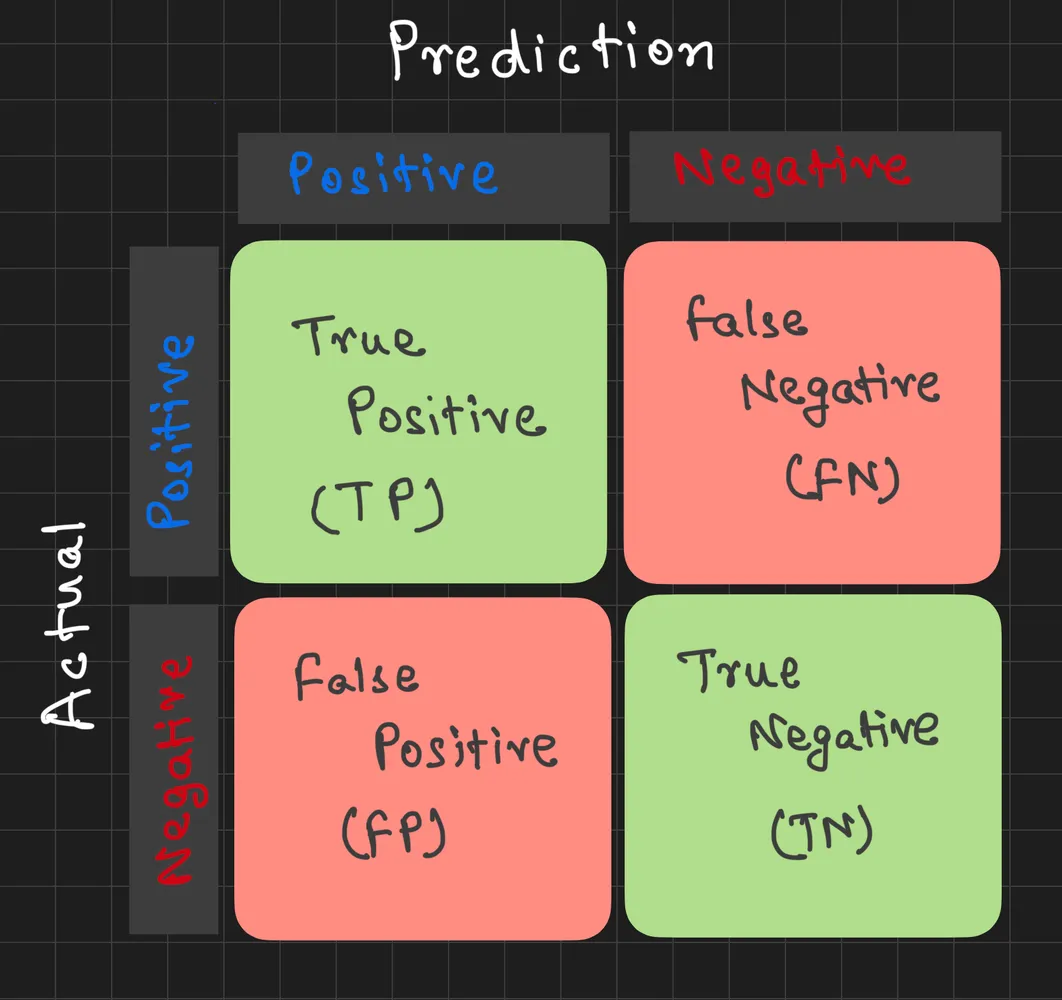
These four outcomes drive all the metrics we’re about to explore.
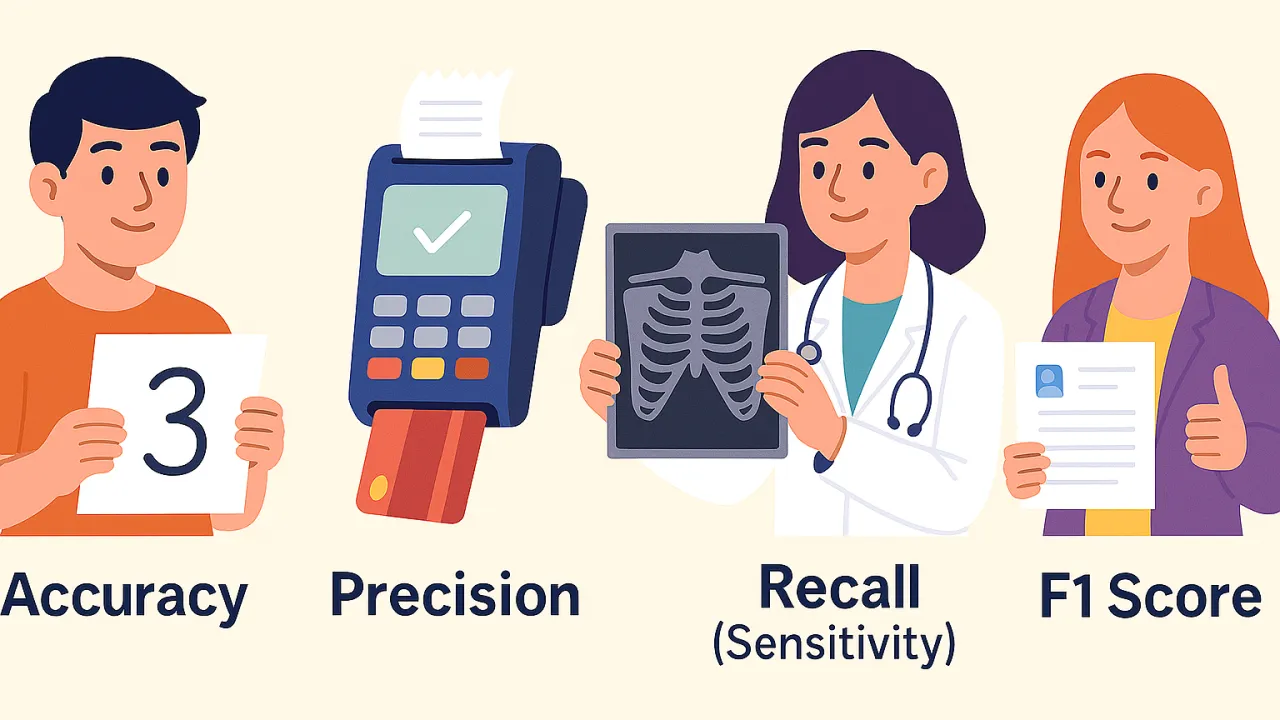
1. Accuracy: When Overall Correctness Is Enough

What it tells you: Out of all the predictions the model made, how many were right?
When it works well: When your classes are balanced and every type of mistake is equally bad.
Real-world example:
Imagine you're building a handwriting recognition system to read handwritten digits (0 through 9). Most digits occur equally often. If the model predicts the correct digit 95% of the time, that is a meaningful signal of performance. In this case, accuracy is a good summary metric.
When to be cautious:
If 95% of your dataset is made up of one class (say, non-spam emails), a model that just predicts “non-spam” will be 95% accurate, but also 100% useless at identifying spam.
2. Precision: When You Care About Being Selective

What it tells you: Out of all the times the model predicted positive, how many were actually positive?
When it works well: When the cost of a false positive is high. Notice, that's why the denominator has false positive.
Real-world example:
Consider a company’s fraud detection system that flags potentially fraudulent credit card transactions. If the model incorrectly flags too many legitimate purchases, customers will be unhappy and the support team will be overwhelmed. In this case, precision is more important. You want to be confident that when the system raises an alert, it's truly suspicious.
3. Recall (Sensitivity): When You Can’t Afford to Miss Anything

What it tells you: Out of all the actual positive cases, how many did the model correctly catch?
When it works well: When the cost of a false negative is high. Notice, that here false negative is in the denominator.
Real-world example:
Now take a cancer screening test. Missing a real cancer case could have life-threatening consequences. Even if the test falsely flags some healthy patients (false positives), it is more important to ensure that every real case is detected. Here, recall is the priority.
4. F1 Score: When You Need Balance

What it tells you: The harmonic mean of precision and recall. It gives you a single number that balances both concerns.
When it works well: When you want a single metric that reflects the balance between missing positives and being overly cautious.
Real-world example:
Imagine you're building a resume screening tool that helps recruiters shortlist candidates. You want to avoid missing out on great candidates (high recall), but also avoid recommending unqualified ones (high precision). Neither metric alone tells the full story. In this case, the F1 score helps you evaluate the trade-off between the two.
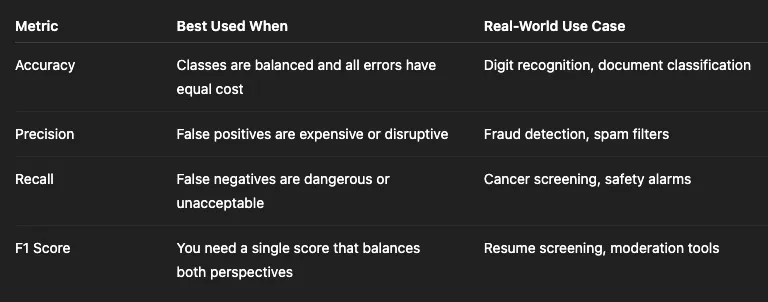
Summary Table: When to Use What
Final Thought
No metric is universally better than the others. Each one answers a different question.
So the next time someone tells you a model has 95% accuracy, don’t stop there. Ask yourself: Was that the right metric for the problem? What were the trade-offs? What kind of mistakes matter most?
Choosing the right metric means thinking beyond the math and into the real-world impact. And that’s what building responsible, useful machine learning systems is all about.
#MachineLearning #ClassificationMetrics #PrecisionRecall #F1Score #ConfusionMatrix #ResponsibleAI #AI #Learning